Candlestick Charts v1.09 WordPress Plugins
₹4,971.28 Original price was: ₹4,971.28.₹491.92Current price is: ₹491.92.
- Version 1.09 [Request Update]
- CodeCanyon,envato
- Candlestick Charts
-
Item Demo
- 8 hours ago
- Plugins
-
Security Scan Report
Highlights
- 6 months of updates & unlimited domain usage
- Updates will be available within a few days
- Original product with the lowest price ever
- Downloaded from original authors
- Instant delivery with fast downloading speed
- 100% clean and tested code
Add Our Services
Candlestick Charts v1.09 WordPress Plugins
PluginsCandlestick Charts11/21/24
Product Installation & Support
Addons09/30/24
Lifetime Updates
Addonslifetime-access10/11/24
100% Website Boost
Addons100% website boost09/30/24

×
Our Product Installation & Support service is designed to provide you with a seamless and hassle-free experience from the moment you purchase your product. Our expert team is dedicated to guiding you through the entire installation process, ensuring that your product is set up correctly and efficiently. We take care of everything from the initial setup to detailed configuration, tailoring the product to meet your specific needs and optimizing settings and features for maximum performance.
Once your product is installed, our support doesn’t end there. We offer ongoing assistance to ensure that you get the most out of your purchase. Our dedicated team of experts is always ready to help you with any issues or questions that may arise. Whether you need help troubleshooting a problem or simply have a question about how to use a feature, our support team is available to provide prompt and effective solutions.
We understand that encountering technical difficulties can be frustrating, which is why our support service includes comprehensive troubleshooting and issue resolution. Our goal is to minimize any downtime and keep your product running smoothly, so you can focus on what matters most. We offer multiple channels of support, including phone, email, and live chat, ensuring that help is always just a click or call away.
Your satisfaction is our top priority. We are committed to providing exceptional service and support to ensure that you are completely satisfied with your product. Our team is dedicated to helping you achieve the best possible results and is always available to assist you with any needs. With our Product Installation & Support service, you can have peace of mind knowing that expert help is always available whenever you need it.

×
The “Lifetime Updates” product is a comprehensive solution designed to ensure that your downloadable software remains current and fully functional throughout its entire lifespan. By opting for this product, you are making a one-time investment that guarantees you will receive all future updates, enhancements, and improvements without any additional cost. This means that as technology evolves and new features are developed, your software will automatically be upgraded to include these advancements, keeping it at the cutting edge of innovation.
From the moment you purchase the “Lifetime Updates” product, you can rest easy knowing that you will always have access to the latest version of your software. This includes not only new features and tools that enhance functionality but also critical security updates that protect your data and ensure the software runs smoothly.
One of the key benefits of the “Lifetime Updates” product is the convenience it offers. You no longer need to worry about manually checking for updates or making additional purchases to access new versions. Everything is handled automatically, so you can focus on using the software to its fullest potential. Whether you are a professional relying on the software for your work or a casual user enjoying its features, you will appreciate the seamless experience that lifetime updates provide.
Moreover, the “Lifetime Updates” product represents a significant value for money. Instead of paying for individual updates or new versions, you make a single purchase that covers all future enhancements. This not only saves you money in the long run but also ensures that your software investment remains valuable and relevant over time. As new technologies emerge and user needs change, your software will adapt accordingly, providing you with the tools and features you need to stay productive and efficient.
In addition to the practical benefits, the “Lifetime Updates” product also offers peace of mind. Knowing that your software will always be up-to-date and supported by a dedicated team of developers allows you to use it with confidence. You can trust that any issues will be promptly addressed and that the software will continue to meet your needs as they evolve. This level of support and commitment is what sets the “Lifetime Updates” product apart, making it an essential addition to your software purchase.
Overall, the “Lifetime Updates” product is an investment in the future of your software. It ensures that you will always have access to the latest features, improvements, and security updates, providing you with a seamless and worry-free experience. Whether you are looking to enhance your productivity, stay ahead of technological advancements, or simply enjoy the latest features, the “Lifetime Updates” product is the perfect solution. Make the smart choice today and secure the future of your software with lifetime updates.

×
Transform your online presence with the 100% Website Boost addon, designed to supercharge your website’s performance, visibility, and user experience. Whether you’re a small business owner, a blogger, or an e-commerce entrepreneur, this powerful tool is your key to unlocking unparalleled growth and success.
With 100% Website Boost, you can expect lightning-fast load times, thanks to optimized performance and advanced caching techniques. Your website will rank higher on search engines with enhanced keyword optimization and meta tag management. Security is a top priority, with robust protection against cyber threats and easy SSL certificate integration.
Your users will enjoy a flawless experience across all devices with mobile-friendly design enhancements and intuitive navigation. Comprehensive analytics provide valuable insights into your website’s performance, helping you track visitor behavior and identify opportunities for improvement.
The benefits of 100% Website Boost include increased traffic, higher conversion rates, and peace of mind knowing your website is secure and reliable. This addon is more than just a performance enhancer; it’s a comprehensive solution designed to elevate every aspect of your website. With easy-to-use tools and expert support, you’ll be able to focus on what you do best—growing your business.
Description
Candlestick Charts WordPress Plugin
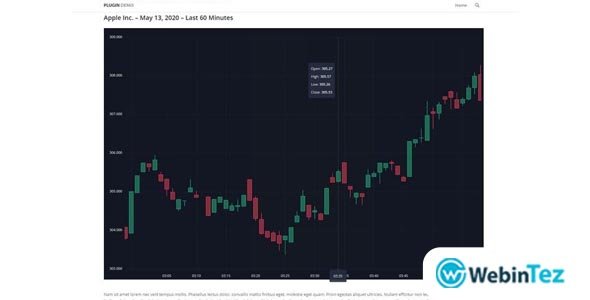
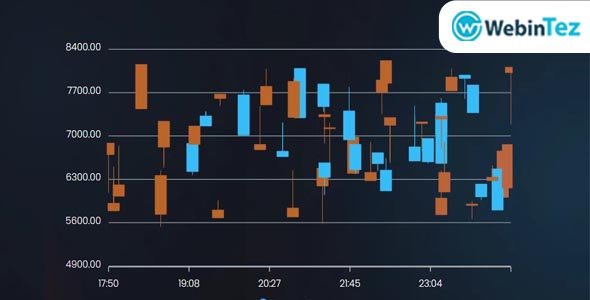
The Candlestick Charts WordPress Plugin is a comprehensive and powerful tool designed to enhance the visualization of financial data on your WordPress site. This versatile plugin provides a range of advanced features that make it easy for users to create, customize, and display candlestick charts, offering clear insights into market trends and price movements. Ideal for financial analysts, traders, and educators, the Candlestick Charts plugin ensures a professional and seamless experience for both creators and viewers.
Key Features:
- Easy Chart Creation: Create candlestick charts with a user friendly interface. The plugin allows users to quickly generate charts by inputting their financial data, offering a simple and efficient chart creation process.
- Real Time Data Integration: Integrate real time financial data into your charts. The plugin supports data feeds from various financial APIs, ensuring that your charts are always up to date with the latest market information.
- Customizable Chart Appearance: Tailor the appearance of your candlestick charts to match your website’s design. The plugin offers a wide range of customization options, including colors, labels, and tooltips, ensuring that your charts are visually appealing and informative.
- Interactive Chart Features: Enhance user engagement with interactive chart features. The plugin includes zooming, panning, and tooltip functionalities, allowing viewers to explore the data in detail.
- Multiple Chart Types: Display different types of financial charts. In addition to candlestick charts, the plugin supports line charts, bar charts, and more, providing flexibility in how you present your data.
- Historical Data Analysis: Analyze historical financial data with ease. The plugin allows users to upload and visualize historical data, helping to identify long term market trends and patterns.
- Mobile Friendly Design: Ensure a seamless experience across all devices. The Candlestick Charts plugin is fully responsive, providing an optimal viewing experience on desktops, tablets, and smartphones.
- Data Import and Export: Easily import and export financial data. The plugin supports various file formats, allowing users to upload their data in CSV or Excel files and download chart data for further analysis.
- Shortcode Integration: Embed charts anywhere on your website with simple shortcodes. The plugin provides easy to use shortcodes that allow you to place your charts on pages, posts, or widgets effortlessly.
- Detailed Documentation: Access comprehensive documentation and tutorials. The plugin comes with detailed guides and resources to help users understand and utilize its features effectively.
- Regular Updates and Support: Benefit from regular updates that introduce new features and improvements. Access dedicated customer support to assist with any questions or issues, ensuring a smooth and hassle free experience.
Benefits of Using Candlestick Charts WordPress Plugin:
- Enhanced Data Visualization: Improve the way you present financial data with visually appealing and informative candlestick charts. The plugin’s advanced customization options ensure that your charts are both professional and engaging.
- Real Time Market Insights: Keep your charts up to date with real time financial data integration. This feature ensures that viewers always have access to the latest market information, making your site a valuable resource.
- User Engagement: Boost user engagement with interactive chart features. The plugin’s zooming, panning, and tooltip functionalities allow viewers to explore data in detail, increasing their understanding and interest.
- Versatile Data Presentation: Display a variety of financial charts to cater to different analytical needs. Whether you prefer candlestick charts, line charts, or bar charts, the plugin provides the flexibility to present your data effectively.
- Historical Analysis: Gain insights into long term market trends with historical data visualization. The ability to upload and analyze historical data helps users make informed decisions based on past performance.
- Accessibility: Ensure that your financial data is accessible to all users. The plugin’s mobile friendly design guarantees a seamless viewing experience on any device, making it easy for users to access charts on the go.
- Ease of Use: Simplify the process of creating and managing charts with user friendly features. The plugin’s intuitive interface, easy data import/export, and shortcode integration make it accessible to users of all skill levels.
- Comprehensive Support: Rely on detailed documentation and dedicated customer support. The plugin’s resources and support team ensure that you can make the most of its features without any hassle.
How does the Candlestick Charts WordPress Plugin enhance the visualization of financial data on a website?
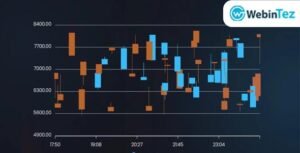
The Candlestick Charts WordPress Plugin enhances the visualization of financial data on a website by providing a user friendly interface for creating detailed candlestick charts. It supports real time data integration from various financial APIs, ensuring that charts are always up to date with the latest market information. The plugin offers extensive customization options, allowing users to tailor the appearance of their charts to match their website’s design. Interactive features such as zooming, panning, and tooltips engage viewers by allowing them to explore data in detail. Additionally, the plugin supports multiple chart types, historical data analysis, and is fully responsive, ensuring an optimal viewing experience across all devices. With features like data import/export and shortcode integration, the plugin simplifies the process of embedding and managing charts, making it an essential tool for financial analysts, traders, and educators.
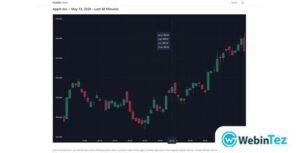
The Candlestick Charts WordPress Plugin offers a multitude of benefits that significantly enhance the visualization and analysis of financial data on your website. By providing an intuitive interface, it allows users to effortlessly create detailed candlestick charts that visually represent market trends and price movements, making complex financial data easier to understand. This capability is particularly beneficial for financial analysts, traders, and educators who need to present data in a clear and engaging manner. The plugin’s ability to integrate real time data from various financial APIs ensures that the charts are always up to date, providing users with the latest market information and enabling informed decision making. Customization options allow users to tailor the appearance of their charts to match their website’s design, ensuring a professional and cohesive look. Interactive features, such as zooming, panning, and tooltips, enhance user engagement by allowing viewers to explore data in detail, increasing their understanding and interest in the presented information. Additionally, the plugin supports multiple chart types, including line charts and bar charts, offering flexibility in how data is displayed. This versatility is crucial for catering to different analytical needs and preferences. The ability to analyze historical data helps identify long term market trends and patterns, providing valuable insights for strategic planning and investment decisions. The plugin’s responsive design ensures that charts are accessible and look great on all devices, from desktops to smartphones, enhancing the user experience across the board. Furthermore, features like data import and export simplify the process of managing financial data, allowing for easy uploads and downloads in various formats such as CSV and Excel. Shortcode integration enables users to embed charts anywhere on their website effortlessly, making it simple to incorporate financial data into blog posts, pages, or widgets. Comprehensive documentation and tutorials provide users with the necessary resources to fully utilize the plugin’s capabilities, while regular updates and dedicated customer support ensure a smooth and hassle free experience. Overall, the Candlestick Charts WordPress Plugin is an indispensable tool for anyone looking to enhance their financial data visualization, offering a seamless blend of functionality, customization, and user engagement.
Reviews and Ratings
Be the first to review “Candlestick Charts v1.09 WordPress Plugins” Cancel reply
Related Items
Astra Pro v4.8.6– WordPress Theme Addon – Plugin
Rated 4.50 out of 5 based on 2 customer ratings
PluginsAstra Pro11/18/24
Gearomatic v1.3.2 – GearBest Affiliate Post Importing Money Generator Plugin for WordPress
Rated 5.00 out of 5 based on 1 customer rating
PluginsGearomatic10/25/24
Magic Christmas Card With Animation v1.1 – WordPress Plugin
Rated 4.00 out of 5 based on 1 customer rating
PluginsMagic Christmas Card With Animation10/25/24
WordPress Automatic Plugin v3.106.0 – Import Content Automatically
Rated 5.00 out of 5 based on 1 customer rating
PluginsWordPress Automatic11/01/24
WordPress Publisher Autopilot v4.3
Rated 5.00 out of 5 based on 1 customer rating
PluginsWordPress Publisher Autopilot10/25/24






Reviews
There are no reviews yet.